BTN’s 2023 Corporate Travel Index is here. It’s your free access to the managed travel industry’s definitive resource of business travel costs in 200 cities around the world. Use it to benchmark your current program or to offer insights into rate
trends in the markets you care about most. Big project coming up in Helsinki? We’ve got that market. New offices opening in Austin, Tex. or Nashville? We’ve got those too. Wherever your company’s business travel takes employees, this resource is your
go-to as you create travel budgets and relevant spending policies, source in-market partners and negotiate rates.
- Q4 2022 Summary Documents – Find a quick resource at the right for downloadable Q4 2022 references for 200 U.S. and Non-U.S. cities.
- Corporate Travel Index Calculator – This tool is updated every quarter and serves as your free, customizable rate reference for year-round data. Choose your target cities, hotel service tiers, car rental tiers and meal selections to understand
likely business travel costs for your program.
Market
Volatility
It’s no secret that rate volatility—and increases—have buffeted business travel budgets for the last three years. BTN’s commitment to updating The Corporate Travel Index on a quarterly basis gives you insights into market seasonality and what you can
expect for corporate rates. Remember: Corporate Travel Index only reflects corporate bookings, not leisure, but does include dynamic rate contracts so market rates still impact these numbers, as does availability of negotiated inventory. The charts
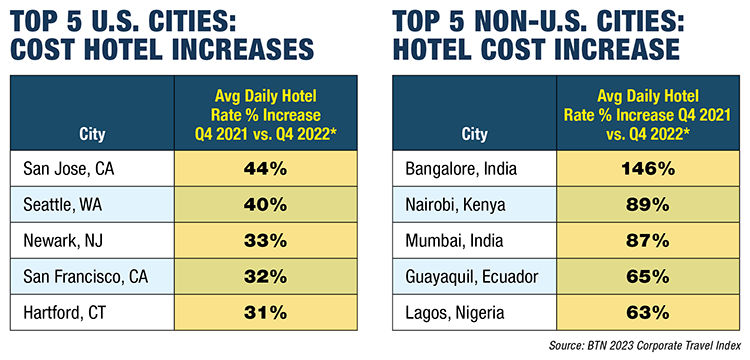
below show the domestic and international cities with the steepest hotel rate increases, looking at Q4 2021 compared to Q3 2022.

Visit the Corporate Travel Index Calculator often for quarterly updates to hotel, car rental and risk data. Taxi cost data for 100 international cities is updated annually.
Meals, Meals, Meals… Your Single
Source
As food costs rise for restaurants, meal prices are going one direction. BTN’s Corporate Travel Index offers the only industry resource for meal costs in 200 major business travel markets. Understanding the value it delivers—and the accuracy required—BTN
has completely rebuilt our restaurant and meal cost database in 2023 to ensure our data reflects real market conditions around dining out in 2023. As meal costs tend to be more durable, we update these on an annual basis, but make no mistake, companies
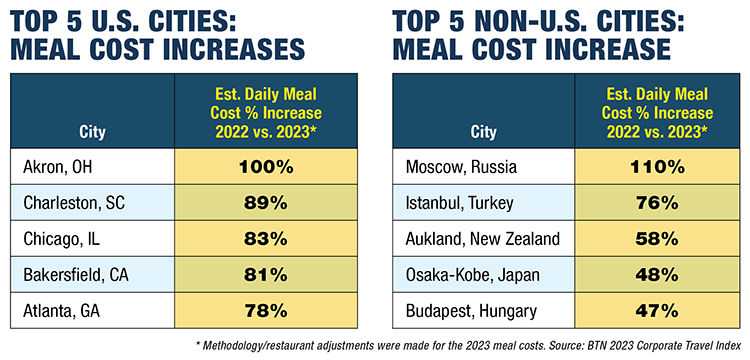
will pay more for business meals this year. Here’s a breakdown of the steepest meal cost increases, both domestic and in international cities.

Let BTN know what information you'd like to see on The Corporate Travel Index. Email Editorial Director Elizabeth West at ewest@thebtngroup.com.
Methodology
Hotel Rates: Advito, Emburse and Prime Numbers provide quarterly aggregated,
anonymized, quarterly U.S. rates booked by corporate clients across five hotel
tiers. Advito, HRS and Prime Numbers provide parallel data for non-U.S. cities.
BTN provides taxes and fees for U.S. cities on an annual basis.
Car Rental Rates: Advito, Emburse and Prime Numbers provide quarterly aggregated,
anonymized, quarterly U.S. car rental rates booked by corporate clients across
three car rental tiers. Advito provides combined local tax and fee data.
Meal Prices: BTN rebuilt its meal and restaurant database in 2023. BTN will update
meal data annually, using the following methodology.
U.S. Meal Data: Cities with annual GDP above $95 billion: BTN surveyed six independent
restaurants and three hotel restaurants for breakfast; for each lunch and dinner,
they surveyed six chain and six independent restaurants. For smaller cities, BTN
surveyed two independent restaurants and one hotel restaurant for breakfast and
three chain and three independent restaurants for each lunch and dinner. Breakfast
is based on an egg entree with fruit and coffee or juice. Lunch is an
entree-style salad or sandwich, pizza, burrito, etc. with fruit; fries or
chips; and nonalcoholic beverage. Dinner is protein-based entree; small salad;
cheese tray or dessert; glass of wine. Sample breakfast restaurants include
Denny’s, IHOP and Starbucks. Lunch chains include Chili's, Panera and Bonefish
Grill. Dinner chains include Cheesecake Factory and Capital Grille.
Non-U.S.Meal Data: Breakfast is based on continental breakfast. For lunch
and dinner in each city that has a population of 1.5 million or more, BTN
surveyed 12 restaurants; in each smaller city, they called six. BTN converted
prices from local currency to U.S. dollars on February 15, 2023. Lunch is based
on a sandwich, salad and nonalcoholic drink. Dinner is based on a fish, chicken
or beef entree; salad; a dessert or cheese tray; glass of wine.
Taxi Rates: BTN compiles taxi rate data annually using Rome2Rio.
Risk Scores: GeoSure synthesizes near real-time traveler safety data using a
proprietary combination of Big Data predictive analytics, artificial
intelligence/natural language processing and crowdsourced input. GeoSafeScores
powered by GeoSure incorporate structured and unstructured data from sources
like the United Nations, Centers for Disease Control and Prevention, World
Health Organization, Interpol, The World Bank, FBI and the U.S. State
Department, as well as macro sources like inflation trends, education, income
levels, political stability, trending health and disease data,
neighborhood-level police presences, healthcare facility proliferation and
infrastructure characteristics. BTN updates risk data quarterly.